Automate reporting using Power BI with SkyPrep LMS
Organizations can automate reporting using Power BI to turn SkyPrep LMS data into clear, real-time insights for corporate training. As a result, HR and L&D managers face less administrative pressure, even as teams grow across multiple locations.
Moreover, this integration eliminates the need for manually downloading reports and streamlines the reporting workflow. Without automation, fragmented SkyPrep exports can make it difficult to combine training data. In addition, downloading multiple CSV or Excel files takes time away from strategic planning.
Consequently, outdated spreadsheets slow decision-making and make reporting less reliable. Therefore, real-time training metrics are especially valuable in regulated industries such as banking and manufacturing.
How to Automate Reporting Using Power BI for SkyPrep LMS
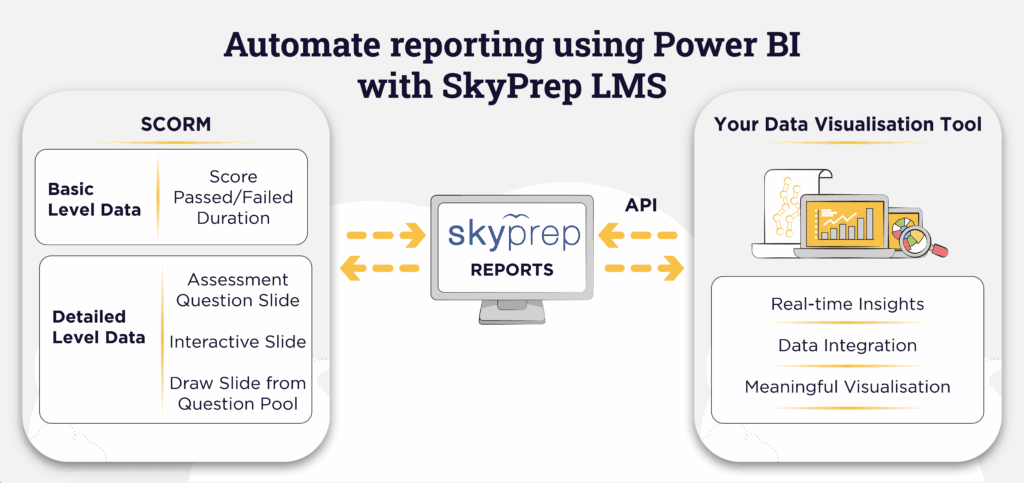
The SkyPrep API creates a secure connection between your LMS and your analytics environment. It pulls live training data into Microsoft dashboards without manual effort.
As a result, L&D managers can review training performance without relying on spreadsheets. In addition, the automated connection provides HR teams with clearer, more actionable insights.
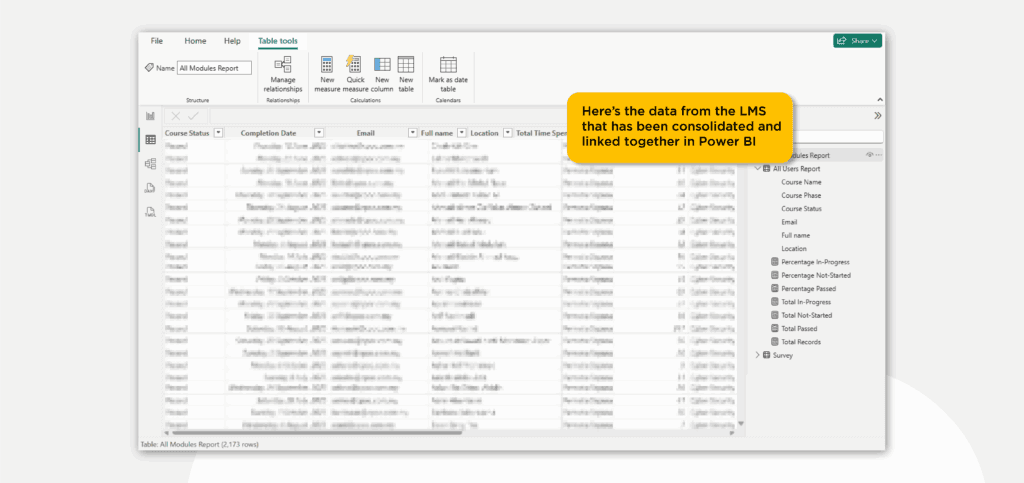
Once SkyPrep data is consolidated in Power BI, it becomes easier to explore and understand. Executives can track compliance, compare regions, and spot skill gaps faster.
Overall, a unified data strategy gives your organization a single source of truth for essential training metrics. Whether you are tracking onboarding or mandatory certification, Power BI gives you the visibility needed to act quickly.
Key Reporting Outcomes for Enterprise L&D Teams
Course Level Reporting
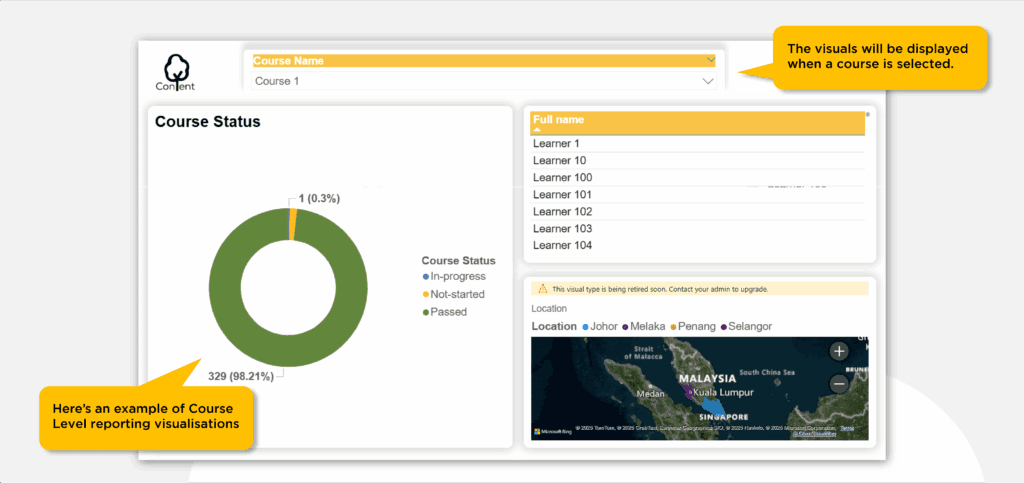
Course-level reports give a clear snapshot of learner enrollment status. Thus, HR teams can quickly see who has passed, who is in progress, and who has not started.
This visibility is important for maintaining compliance throughout the year. Additionally, you can filter dashboards by location, department, or subsidiary.
If one branch falls behind on mandatory training, stakeholders can quickly identify the issue. Therefore, it becomes easier for L&D teams to deliver targeted support where it is needed most.
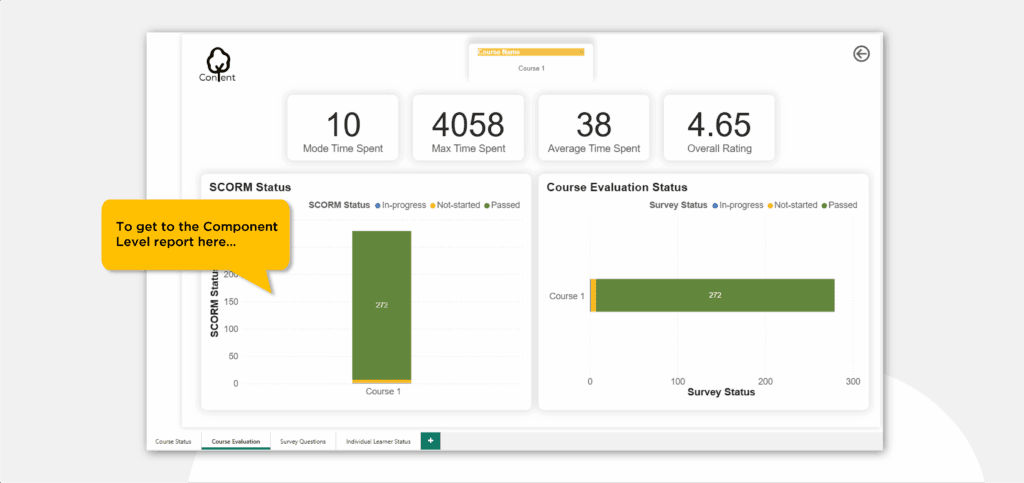
Component Level Reporting
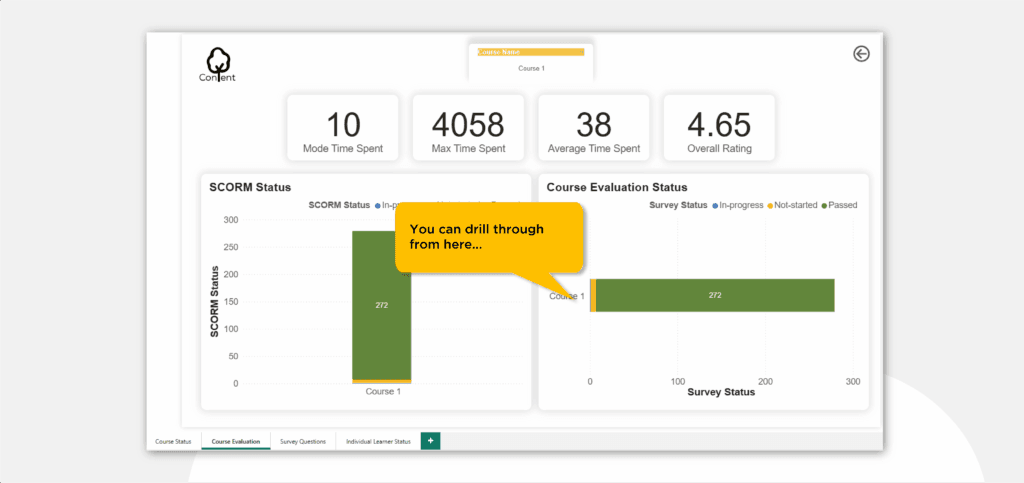
Component-level reports provide a deeper view into the quality of your e-learning content. For instance, these dashboards show average time spent on each module and track SCORM status across the course.
Consequently, it is easier to see how your training materials perform in practice. Moreover, the API can pull survey responses into a clean, dashboard-ready format.
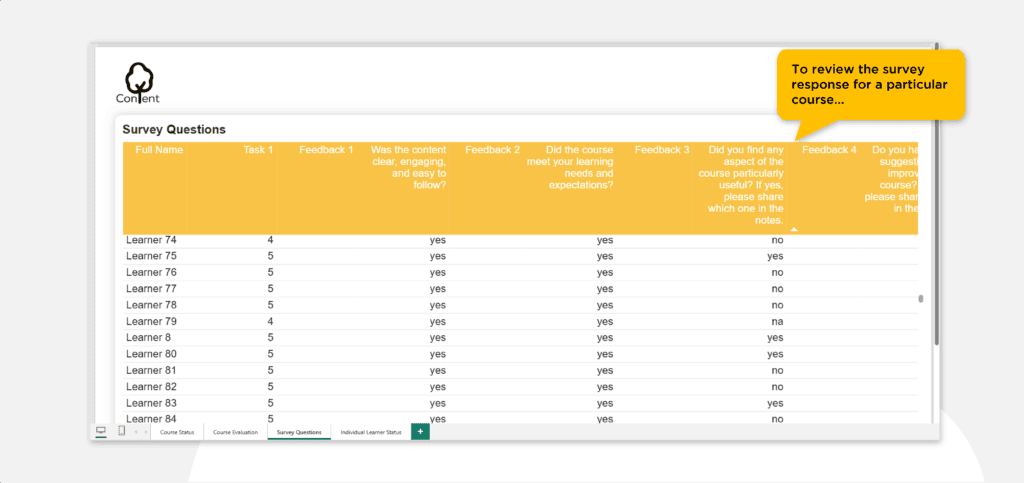
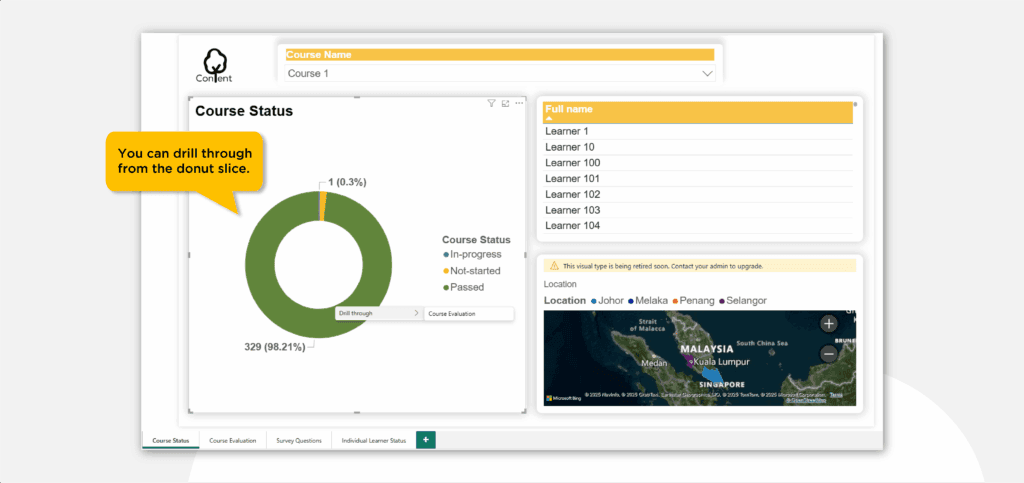
Survey Level Report
Reviewing learner feedback is important for continuous improvement. For example, low engagement scores may indicate where captions, on-screen text, or content design need improvement.
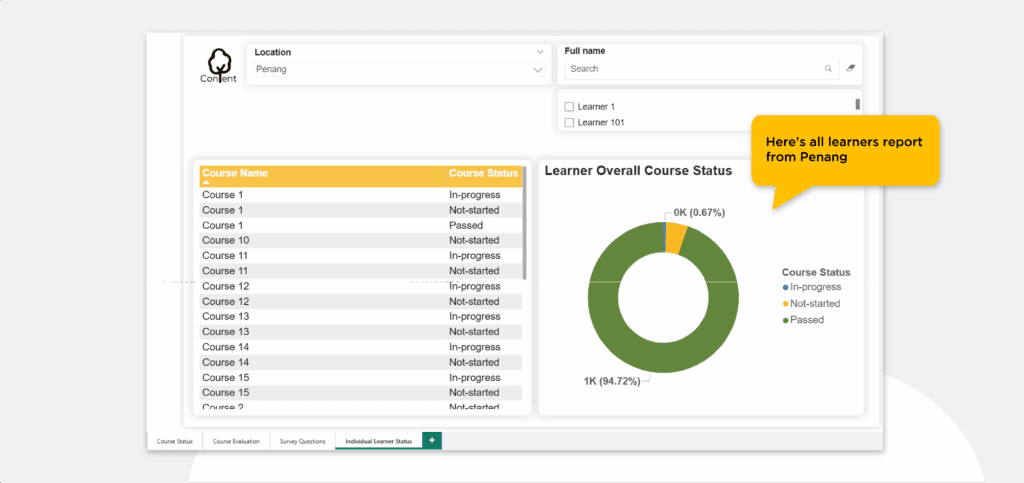
Learner Level Reporting
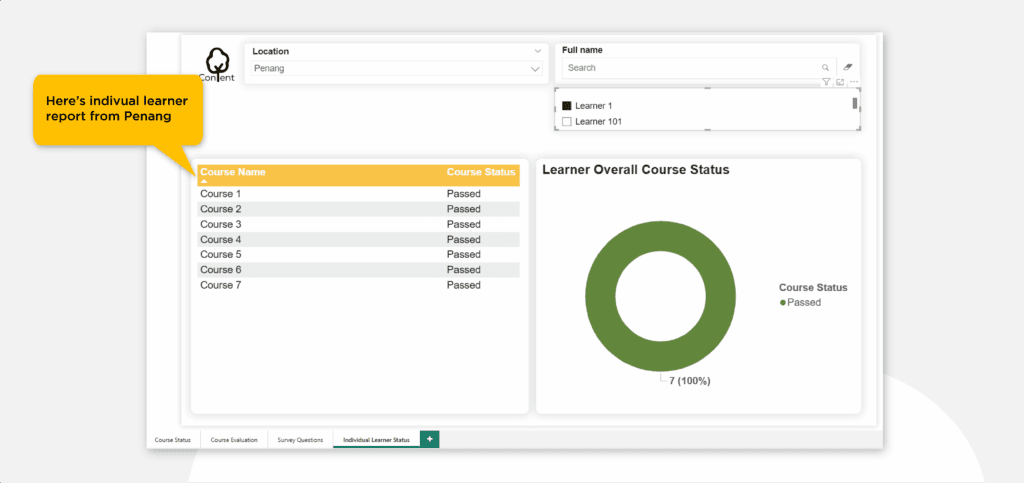
Learner-level reports focus on individual employee performance across the organization. Additionally, if your workforce is spread across multiple locations, you can map learners geographically.
This geographic view helps centralized HR teams track training progress by region. In addition, supervisors can review detailed tables showing which courses each employee has completed.
When combined with charts, these tables give managers a clearer picture of individual competencies. As a result, strong performers are easier to identify, while employees who need help can receive support sooner.
Why Organization Use This Integration
The goal of corporate training is to deliver measurable business results. Therefore, when you automate reporting using Power BI, it becomes easier to track outcomes and improve training ROI.
Furthermore, this reduces human error, lowers administrative overhead, and gives your team more time to improve the learning strategy. In addition, it gives stakeholders better visibility into key training initiatives.
Ultimately, real-time analytics support faster decision-making and more responsive training operations. Used effectively, the SkyPrep API helps build a more data-driven learning culture.
FAQ
How does the API integration improve data visualization?
Firstly, API syncs real-time SCORM and survey data, enabling dynamic dashboards without manual uploads.
Can we track employee progress across different Indonesian cities?
Absolutely, HR can filter learner data geographically to monitor compliance across all regional offices.
Do I need a technical team to set this up in Power BI?
Moreover, we provide templates, but advanced dashboards may require technical expert support.
What specific SkyPrep reports can we visualize?
Essentially, you can use modules, user, and survey reports to build course and learner insights.
Is the data transfer secure for corporate use?
Yes, indeed, API uses encryption protocols to ensure secure and private data transfer at all times.