In Part 1, we automated high-level reporting. In Part 2, we captured learner sentiment. Now, we explore the “Truth Layer”—the SCORM Report.
Completion rates show who finished, but SCORM interaction data reveals what learners truly know. By leveraging Articulate Storyline’s advanced features, our extraction tool helps organizations in Indonesia move from simple scores to comprehensive competency mapping.
The Challenge of Randomized Question Banks
Sophisticated e-learning modules often use Question Banks. By randomly drawing questions from various pools, such as Topic 1: Cyber Security and Topic 1: Phishing, you ensure that no two learners share the same assessment experience.
However, this approach creates a reporting nightmare. Standard LMS exports frequently fail to group these randomized questions, leading to a chaotic data set for L&D teams. Our tool resolves this issue by organizing data into three distinct, actionable worksheets:
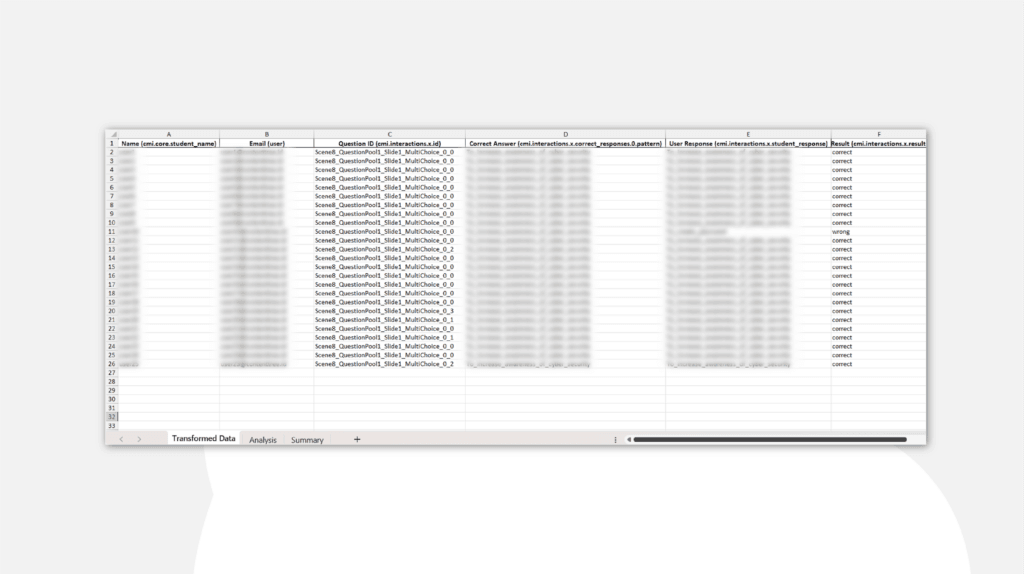
1. The "Transformed Data" Worksheet: The Audit Trail
This foundation captures individual learner responses for every assessment slide. Additionally, it tracks each student’s answer against the correct one, providing a complete audit trail for compliance and quality assurance.
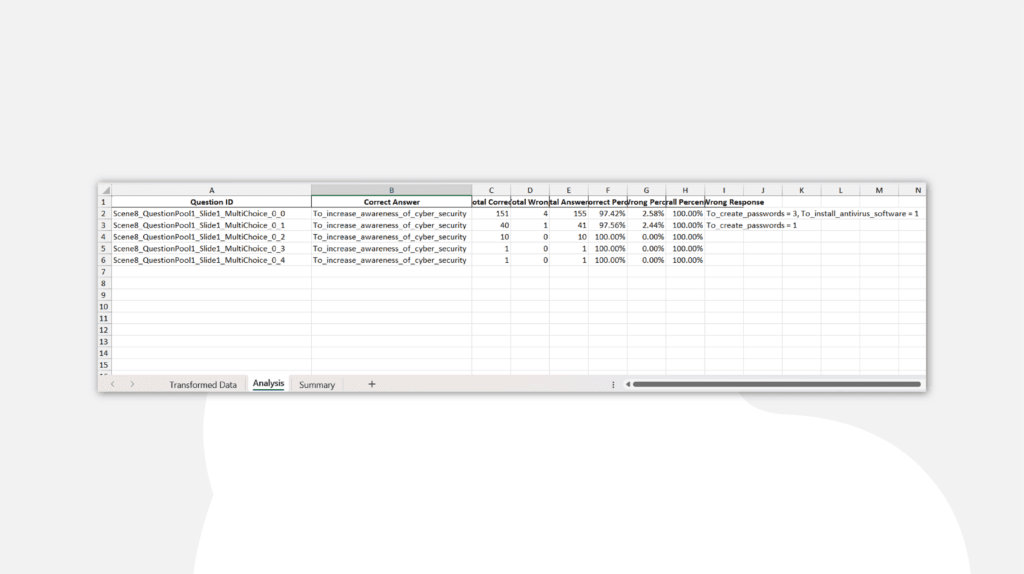
2. The "Analysis" Worksheet: The Intelligence Layer (Why it matters)
You might wonder why this middle step is necessary. When using Articulate Storyline’s “Draw Slide” mechanism, the LMS receives data in variations, such as Question 0_0 and 0_1. This worksheet acts as the tool’s brain, identifying and grouping these variations to ensure that the data remains normalized despite randomization.
Furthermore, this layer showcases the tool’s technical superiority, as it manages complex randomization and “draw” logic that would overwhelm a standard Excel pivot table.
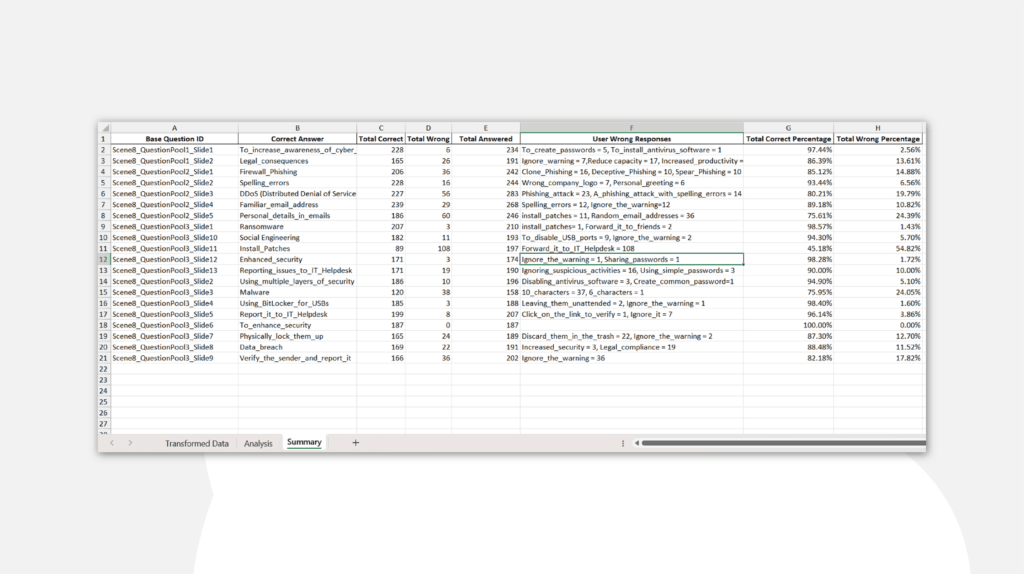
3. The "Summary" Worksheet: Actionable Topic Analytics
This section provides valuable insights for L&D managers. The tool aggregates all data into Topic-Level Analytics based on your question banks.
- Identify Weaknesses: See exactly which topics (e.g., Topic 1) have the highest failure rates.
- Distractor Analysis: The tool doesn’t just say an answer was “wrong.” It tells you which wrong answer was chosen most often.
For example, if 60 learners select “To_create_complex_passwords” instead of the correct cyber security protocol, you can identify a common misunderstanding.
Closing the Loop on Training Excellence
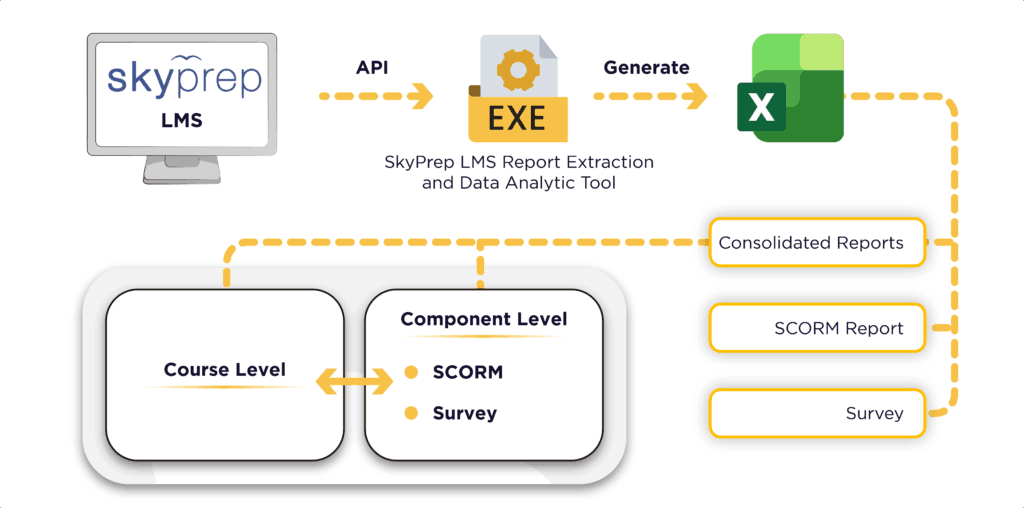
Throughout this three-part series, we explored how the SkyPrep LMS Report Extraction and Data Analytics Tool transforms your reporting workflow.
- Consolidated Reports give you the big picture.
- Survey/Checklist Reports capture the learner’s voice.
- SCORM Reports provide the technical proof of knowledge.
Moreover, for organizations in Indonesia aiming to excel in L&D, this tool is not just about saving time; it provides essential insights to build a smarter, more capable workforce.
FAQ
How does the tool handle randomized questions from Articulate Storyline?
The tool recognizes “Draw Slide” variations and groups randomized questions from the same bank. This approach ensures consistent reporting, even when learners encounter different questions.
What is "Distractor Analysis" and why is it useful?
Additionally, this analysis reveals which specific wrong answers learners select. If many learners choose the same incorrect answer, it signals a common misunderstanding that the L&D team can address.
Can I see performance by Topic?
Yes, by organizing questions into banks (e.g., Bank 01, 11, 21), the “Summary” worksheet provides a clear view of which subjects learners understand well and which ones need more focus.
Does this work with single-response and multiple-choice questions?
Furthermore, the tool extracts and analyzes various question types, including multiple-choice, single-response, and Yes/No questions directly from the SCORM interaction data.
Why is the "Analysis" tab important if I only need the Summary?
The Analysis tab acts as the quality control layer. It ensures that complex data drawn from Storyline’s randomization engine is correctly categorized before it reaches your final summary, guaranteeing that your management reports are based on accurate data.